What is an
oscilloscope used for?
- Measuring time-varying
signals - by showing details of the waveshape
- Measuring aspects of
time-varying signals
- Frequency of a
signal
- Peak value of a
signal
The oscilloscope is the
most powerful instrument in our arsenal of electronic instruments. It is widely
used for measurement of time-varying signals. Any time you have a signal that
varies with time - slowly or quickly - you can use an oscilloscope to measure it
- to look at it, and to find any unexpected features in it.
The features you see in
a signal when you use an oscilloscope to look at a signal are features you
cannot see otherwise. In this lesson you will learn about oscilloscopes and you
should keep this goal in mind as you proceed through the lesson.
 Given
a time varying signal that you need information about,
 Be able to use an oscilloscope to portray the signal as a function of
time.
 Be able to measure signal parameters with an oscilloscope.
What does an
oscilloscope look like?
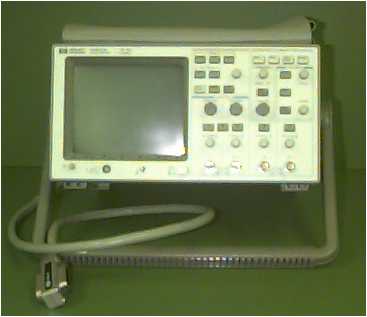
- Here's a photo of a
Hewlett-Packard (HP) 54601A

Note the following features of the
oscillscope
- There is a CRT (Cathode
Ray Tube) screen on which the signals will be presented. That's at the
left.
- There are numerous
controls to control things like:
- The time scale of
the presentation
- A vertical scale
- A cable (IEEE-488) to
connect the oscilloscope to a computer. That lets you:
- Take measurements
with the scope
- Put the measurements
in a computer file
- Analyse the data
with Mathcad, Matlab, Excel, etc.
- Notice that this
oscilloscope has two input channels. The controls for the two channels are
just to the right of the screen.
How do you use
an oscilloscope?
- Plug it in.
That's not facetious.
- Turn it on.
There is a push button at the lower right edge of the screen. It says
"Line" and indicates a "0" and a "1" setting. Depress that button.
- Apply a signal to the
input terminals.
- Your oscilloscope
may have provision for more than one signal input. Choose Channel 1 if
that is the case.
- Make sure that the
settings match the signal. For example:
- If you have a signal
at 1000 Hz, then the period of the signal is 1 millisecond (.001 sec)
and you would not want the time scale set so that you only display a
microsecond of data, and you also probably won't see much if you display
10 seconds worth of data.
- If you have a signal
that is 10 millivolts high, you won't see much if you set the
oscilloscope to shown you a signal at 20 volts full-scale. Conversely,
you won't see much of a 20 volt signal if the scope is set for 10
millivolts full-scale.
Showing a
Simple Signal on the Scope
To get familiar with the scope, you can
show a sine signal on the scope. We're going to ask that you show a signal with
the following characteristics
- 1 volt (2v
peak-to-peak) signal. In other words, it has a
peak of 1 volt and a negative "peak" at -1 volt.
- A frequency of
1000 Hz (i.e. 1
KHz).
- A
sinusoidal signal. In
other words, it looks like a familiar sine wave.
What will the
signal look like?
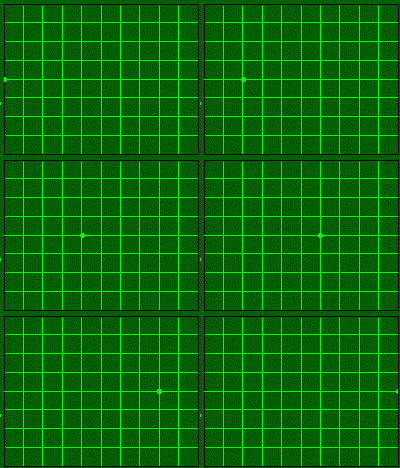
The oscilloscope has an illuminated dot
that moves across the screen. With no signal, it would look like the following.

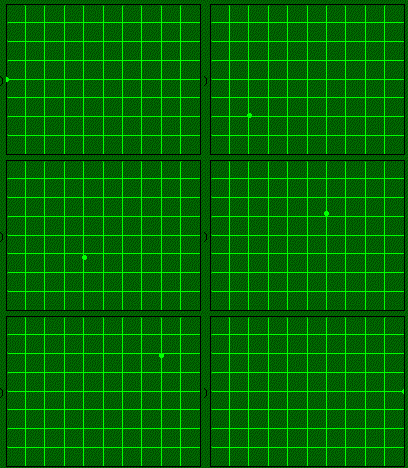
When a sinusoidal signal is applied, then the
vertical position is proportional to the voltage at any instant. If you applied
a low frequency sine signal, you would get a track like the one below.

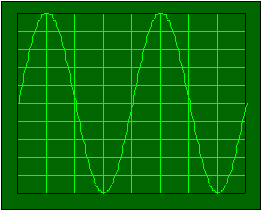
If you have a sinusoidal signal that
repeats every half millisecond - a frequency of 2kHz - you would get a picture
like this one. It would appear to be stationary on the oscilloscope screen, but
it really isn't. It's just that it repeats so frequently that you see it as a
constant image.


