| Using an Oscilloscope (Intro) |
Using An Oscilloscope
What is an
oscilloscope used for?
The oscilloscope is the most
powerful instrument in our arsenal of electronic instruments. It is widely used
for measurement of time-varying signals. Any time you have a signal that varies
with time - slowly or quickly - you can use an oscilloscope to measure it - to
look at it, and to find any unexpected features in it.
The features you see in a
signal when you use an oscilloscope to look at a signal are features you cannot
see otherwise. In this lesson you will learn about oscilloscopes and you should
keep this goal in mind as you proceed through the lesson.
 Given
a time varying signal that you need information about, Given
a time varying signal that you need information about,
 Be able to use an oscilloscope to portray the signal as a function of
time. Be able to use an oscilloscope to portray the signal as a function of
time.
 Be able to measure signal parameters with an oscilloscope. Be able to measure signal parameters with an oscilloscope.
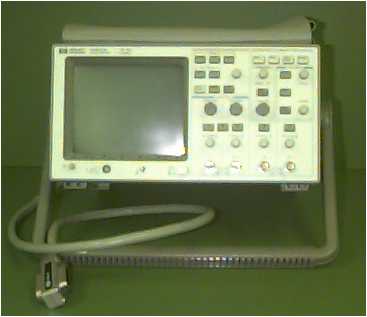
What does
an oscilloscope look like?

Note the following features of the
oscillscope
There is a CRT (Cathode Ray
Tube) screen on which the signals will be presented. That's at the left. There are numerous controls
to control things like:
A cable (IEEE-488) to connect
the oscilloscope to a computer. That lets you:
Take measurements with
the scope Put the measurements in a
computer file Analyse the data with
Mathcad, Matlab, Excel, etc.
Notice that this oscilloscope
has two input channels. The controls for the two channels are just to the
right of the screen.
How do you
use an oscilloscope?
Plug it in.
That's not facetious. Turn it on.
There is a push button at the lower right edge of the screen. It says
"Line" and indicates a "0" and a "1" setting. Depress that button. - Apply a signal to the input
terminals.
Make sure that the
settings match the signal. For example:
If you have a signal at
1000 Hz, then the period of the signal is 1 millisecond (.001 sec) and
you would not want the time scale set so that you only display a
microsecond of data, and you also probably won't see much if you display
10 seconds worth of data. If you have a signal that
is 10 millivolts high, you won't see much if you set the oscilloscope to
shown you a signal at 20 volts full-scale. Conversely, you won't see
much of a 20 volt signal if the scope is set for 10 millivolts
full-scale.
Showing a
Simple Signal on the Scope
To get familiar with the scope, you can
show a sine signal on the scope. We're going to ask that you show a signal with
the following characteristics
1 volt (2v
peak-to-peak) signal. In other words, it has a
peak of 1 volt and a negative "peak" at -1 volt. A frequency of
1000 Hz (i.e. 1 KHz). A
sinusoidal signal. In
other words, it looks like a familiar sine wave.
What will
the signal look like?
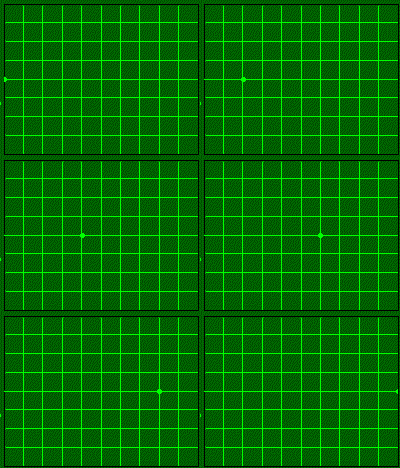
The oscilloscope has an illuminated dot
that moves across the screen. With no signal, it would look like the following.

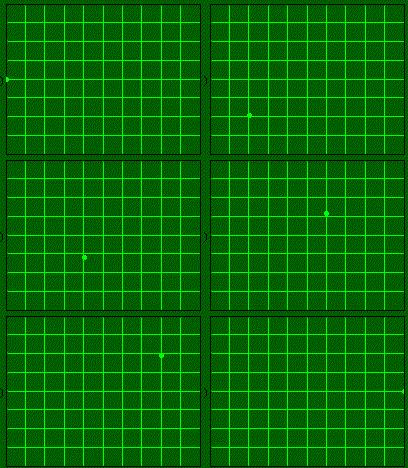
When a sinusoidal signal is applied, then the
vertical position is proportional to the voltage at any instant. If you applied
a low frequency sine signal, you would get a track like the one below.

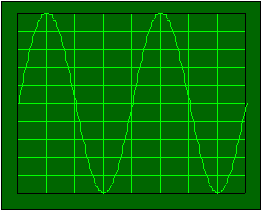
If you have a sinusoidal signal that
repeats every half millisecond - a frequency of 2kHz - you would get a picture
like this one. It would appear to be stationary on the oscilloscope screen, but
it really isn't. It's just that it repeats so frequently that you see it as a
constant image.

Simulation
In this simulation, a
simulated function generator is connected to a simulated oscillscope. Both are
simplified versions of real instruments. Note the following.
The function generator can
produce a number of signals, including sine and cosine, square, triangular
and sawtooth signals. You can choose which signal the function generator
produces by clicking on the appropriate button.
Notice the following in this
simulation.
An oscilloscope
displays a signal, and there is a unique time when the oscillscope trace
begins to move across the screen. There may be a unique event that
triggers the start of the
display - when the oscilloscope trace begins to move across the screen. In
the simulation above, we have given you a button that starts the trace
moving across the screen - a trigger button.
Clearly you cannot trigger an
oscilloscope by hitting a button every time you want to observe a new trace on
an oscilloscope. Another alternative might be to let the oscilloscope
free-run. In other words, let the oscilloscope start another trace as soon as a
trace is finished. Here is a simulation of that situation.
Simulation - Free Running Oscillscope
In this simulation, the
signal trace begins anew as soon as it reaches the right hand side of the
oscilloscope screen.
Notice the following about
this situation.
The value at which the trace
starts is equal to the last value displayed at the end of the previous
trace. That implies that the signal
is displayed continuously, and that you see ever bit of the signal. If the sweep speed - the
speed at which the trace moves across the screen - were much higher, the
display would be a jumble. We can't speed up the sweep
enough to really show you that. We can, however, speed it up just a bit,
and here is the simulation.
Note the following about
what happens when the sweep speed changes.
When the sweep speed changes,
the horizontal scale - the time scale - changes. Although this is a
simulated oscilloscope and function generator, we have designed things so
that it is real-time. In real oscilloscopes, everything is real time and
when you change the time scale you change the sweep speed accordingly. On
an oscilloscope, you can always adjust the sweep speed to "match" the
time-scale of the signal you are displaying.
In a real oscilloscope, the trigger signal
can be generated when the signal value reaches some particular level - the
trigger level. In most cases you can set the
trigger level to a voltage value of your choosing.
Now that you have had a
chance to experiment with the simulations above, it's time to define a few terms
- and these are items you can control on most oscillscope.
You can control the
sweep speed.
Sweep speed is usually measured in units of time per distance, like
milliseconds/centimeter.
This might also be referred to as the horizontal sensitivity. You can control the
vertical sensitivity.
That's the measure of how sensitive the display dot is to voltage applied to
the input terminals. It is usually measured in
volts/centimeter.
Question
Q1
You have a signal that is somewhere in the neighborhood of 100 KHz. That's a
period of 10 msec.
The oscilloscope screen is 10 cm wide. What sweep setting would you use if you
wanted to display a few cycles of your signal across the screen?
|

