Why Measure Signals?
Electrical signals - time varying voltages and currents - in many cases
have important properties that you may have to measure. Sometime
in the future you might have to make any of these kinds of measurements.
-
Power in an audio signal
- as you test an audio amplifier's output capability
-
Frequency - as you use
an AC tachometer to measure a motor's rpm.
-
Amplitude - as you measure
signal strength in a communication system.
Goals
For This Lesson
Goals for this lesson are simple.
 Given a signal,
 Be able to determine signal parameters including RMS voltage, peak-to-peak
voltage and average voltage.
What
Can You Measure In Signals?
There are lots of different properties of signals that you can measure.
If we examine sinusoidal signals we can note several properties of a sinusoidal
signal we might want to measure. Those are the three parameters you
need to specify to describe a sinusoidal signal completely.
The mathematical function we use to describe a sinusoidal signal is a general
sine function. Let's say that we have a sinusoidal voltage signal,
V(t). Then we must have:
V(t) = Vmaxsin(wt
+ f)
There are three parameters here.
-
Vmax
= amplitude,
-
w
= angular frequency,
-
f
= phase.
Now,
over the years various kinds of instruments have been designed to measure
amplitude, frequency and phase. However, there are instruments that
also measure other asspects of signals - even other aspects of sinusoidal
signals. There may be aspects of signals that you haven't thought
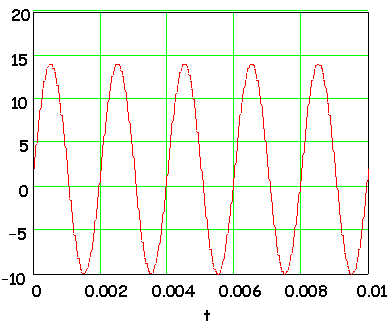
about. Consider the signal in this figure.

Closely examining this signal will let you see
that the signal runs from -10 to +14 volts. It can't be represented
as a pure sinusoid with an expression like:
V(t) = Vmaxsin(wt
+ f)
It can't be represented
that way because a pure sinusoid has positive and negative extremes of
the same absolute value. One way to characterize this signal is to
give the peak-to-peak value of the signal.
The peak-to-peak (or just P-P, and we might represent a voltage as Vpp.)
value is the algebraic difference between the largest voltage in the signal
and the lowest voltage in the signal. Here we would have:
Vpp
= 14 - (-10) = 24v
Here are some other things you might want
to measure for a sinusoidal signal.
-
The peak-to-peak voltage
of the signal.
-
The RMS value of the signal.
Question
Q1 Here
is a simulator that will let you add a DC component to a cosine wave.
Using this simulator set the amplitude to 120v,
run the simulator and determine the peak-to-peak voltage. Record
that value for later use.
Then,
add a DC component of -50v, clear the plot and run the simulator again.
Again, determine the peak-to-peak voltage, then answer this question.
Is the peak-to-peak smaller, larger or the same?
Peak-to-peak
Voltage
Peak-to-peak voltage is a pretty simple concept. If you have a signal,
the peak-to-peak value of the volage is simply the difference between the
largest voltage (usually positive) and the smallest voltage (usually
negative). Here is the example signal from above.

As we found earlier, the peak-to-peak voltage
is given by:
Vpp
= 14 - (-10) = 24v
Looking at the signal a little closer we
might suspect that the signal plotted above has a mathematical description
something like the following:
V(t) = 2 + 12sin(2p500t)
That's the function we used to generate the
signal. It illustrates two aspects of signals.
-
More complex signals can
often be expressed as sums of simpler signals. That will be important
when you need to use Fourier Series.
-
Signals do not have to
be symmetric around zero. They don't have to be symmetric at all.
-
A constant component (DC
component) will shift the signal.
|

