| An Introduction To Fourier Analysis |
An Introduction To Fourier Analysis
What are you trying to do
in this lesson?
Here are some goals for this lesson
 Given a signal as a time function,
 Be able to compute the frequency components of the signal.
 Be able to predict how the signal will interact with linear systems and
circuits using frequency response methods.
The first goal is really to be able to
express a periodic signal in frequency response language. The second goal is to
be able to take a frequency representation of a signal and use that
representation to predict how the signal will interact with systems.
Why Use
Frequency Representations When We Can Represent Any Signal With Time Functions?
Signals are functions of time. A frequency
response representation is a way of representing the same signal as a frequency
function. Why bother - especially when we can represent the signal as a function
of time and manipulate it any way we want there? For example,
- In a system, if we have the
time function, we can solve an input-output differential equation to get the
output, and
- We can plot functions of time
and get information about them, and
- etc., etc.
Frequency response methods give a
different kind of insight
into a system. Those insights can have unexpected results.

Frequency methods focus on how signals of
different frequencies are represented in a signal. We think in terms of the
spectrum of the signal. Here is a rainbow. In a
rainbow, white sunlight - composed of many different colors or parts of the
spectrum - is spread into its spectrum. Here the atmosphere is a filter that
treats the different parts of the light spectrum - the different light
frequencies - in different ways. For a rainbow, the different parts of the
light spectrum - the different colors - are bent differently as they enter the
atmosphere. In many electrical circuits and systems, the different parts of the
signal spectrum are treated differently. Different treatment of different
parts of the electromagnetic spectrum means that you can separate out different
radio, television and cell phone signals. That gives you one very strong reason
to learn about frequency methods. In a linear system, frequency methods may be
easier to apply, and may give insight you would not get otherwise.
- In a system, if we have
the time function, we can solve an input-output
differential equation to
get the output, but if we use frequency-based methods we may only need to do
some algebra to
get the output. Most of us would rather do algebra than solve differential
equations.
- Information about frequency
content of a signal has often proved to give more insight into how to
process a signal to remove noise. Often it is easier to characterize the
frequency content of a noise signal than it is to give a time description of
the noise.
So, give it a shot and try learning about
frequency response methods. They can save you time and money in the long run.
Goals:
What are you trying to do in this lesson?
 Given a signal as a time function,
 Be able to compute the frequency components of the signal.
 Be
able to predict how the signal will interact with linearsystems and
circuits using frequency response methods. Be
able to predict how the signal will interact with linearsystems and
circuits using frequency response methods.
The
Fourier Series
Some time ago, Fourier, doing heat transfer
work, demonstrated that any periodic signal can be viewed as a linear
composition of sine waves. Lets look at a periodic wave. Here is an example plot
of a signal that repeats every second.
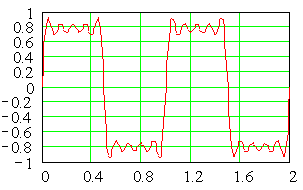 Clearly this signal is not a sinusoid - and
it looks as though it has no relationship to sinusoidal signals. However, over a
century ago, Fourier showed that a periodic signal can always be represented as
a sum of sinusoids (sines and cosines, or sines with angles). That
representation is now called a Fourier Series in his honor.
Fourier not only
showed that it was possible to represent a periodic signal with sinusoids, he
showed how to do it. Assuming this signal repeats every T seconds, then
we can describe it as a sum of sinusoids. Here is the form of the sum. Fourier
gave an explicit way to get the coefficients in a Fourier Series and we need to
look at that in a while. First we are going to look at how a signal can be
built from a sum of sinusoids.

Here's that signal again. Is this signal a sum of
sinusoids? We will examine that question here now, starting with a single sine
signal.
 Here is a single sine signal.
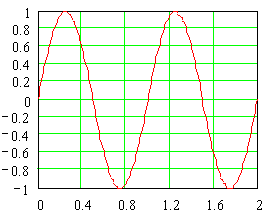 The expression for this signal is just:
Sig(t) = 1 * sin(2pt/T)
and T = 1 second.
Now, we are going to add one other sine to our
original sine signal. The sine we add will be at three times the frequency of
the original and it will be one third as large.
Sig(t) = 1 * sin(2pt/T)
+ (1/3) * sin(6pt/T)
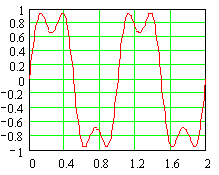
This looks a little different. Continue by adding
one more sine signal - at five times the original frequency and one-fifth of the
original size.
Sig(t) = 1 * sin(2pt/T)
+ (1/3) * sin(6pt/T)
+ (1/5) * sin(10pt/T)
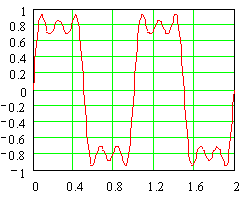 This is getting interesting. We are just adding in
terms at odd multiples of the original frequency. Here's what the signal looks
like with the terms up to the 11th multiple.
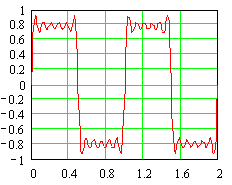 This looks like a fairly lousy square wave. Let's add
a lot more terms and see what happens.
Here is the signal with terms up to the 49th
multiple.
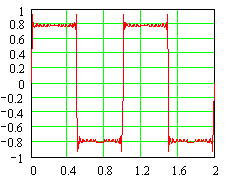 At this point is seems that this process is
giving us a signal that is getting closer and closer to a square wave signal.
However, this looks like a fairly lousy square wave. Let's add a lot more
terms and see what happens.
Here is the signal with odd terms up to
the 79th multiple. Now we're getting a pretty clear indication of a square wave
with an amplitude a little under 0.8. In fact, the way we are building this
signal we are using Fourier's results. We know the formula for the series that
converges to a square wave.
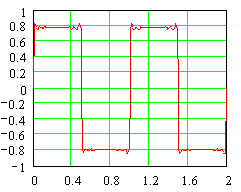
In fact, the way we are building this
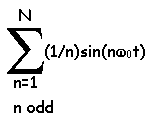
signal we are using Fourier's results. We know the formula for the series that
converges to a square wave. Here's the formula. For a perfectly accurate
representation, let N go to infinity.
|

