| Bode' Plots |
Today, engineers are often more concerned
with things like voltage gain. The resistances and power involved are not a
concern at all when analyzing control systems, so the resistance term is
ignored, and we take the gain, in db, of a system to be:
Gaindb = 20
log10(Vo/Vi)
We should realize that we can plot
gain, in db, for a system as a function of frequency. The ratio of output
voltage to input voltage is simply the ratio of output amplitude to input
amplitude at some frequency - our old friend, frequency response.
OK! You know about decibels. But
there's some other things you need to know about Bode' plots. The vertical
axis on a true Bode' plot is scaled in db. The horizontal axis is scaled
using a logarithmic frequency scale. Here's some not-so-obvious facts about
the frequency scale.
 An
increase of frequency by a factor of 10
is referred to as a
decade. That's a
fairly obvious reference. Ten years is a decade when speaking of time.
Our currency is based on a decimal system because it's based on factors
of 10. An
increase of frequency by a factor of 10
is referred to as a
decade. That's a
fairly obvious reference. Ten years is a decade when speaking of time.
Our currency is based on a decimal system because it's based on factors
of 10.
 An
increase of frequency by a factor of 2
is referred to as an octave.
We're getting into the Latin and Greek roots here. Decade is based on a
Latin root - referring to the number 10. Octave is based on a classical
root referring to the number two - or is it? Right or wrong? An
increase of frequency by a factor of 2
is referred to as an octave.
We're getting into the Latin and Greek roots here. Decade is based on a
Latin root - referring to the number 10. Octave is based on a classical
root referring to the number two - or is it? Right or wrong?
Wrong! Octave refers to eight, not
two. The reason a doubling of frequency is called an octave is that the
musical world defined the term far earlier than we ever thought of it. An
octave is a doubling of frequency, but it's eight notes in the scale to go
up an octave.
Ok, now we're going to put this all
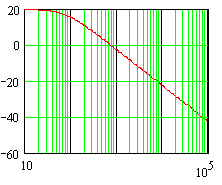
together. Here's a Bode' plot for a first order system. It has a DC gain of
20db, and a corner frequency near f = 80 Hz. Now, look at the slope of the
high frequency portion of the plot.

Every decade increase
causes the same decrease in dbs. Actually, every octave
increase causes equal decreases in dbs. The slope appears to be
-20 db/decade.
Check that this is the slope for any
decade, from 1000 to 10,000 or from 3000 to 30,000 Hz.
If we go back to the transfer function
for a first order system, we can re-examine the high frequency behavior.
Here's the transfer function.
G(jw)
= 1/(jwt+
1)
G(jw)
~= 1/jwt
|G(jw)|
~= 1/wt
log(|G(jw)|)
= log(1/wt)
= -log(wt)
= -log(w)
- log(t)
Express things in terms of decibels.
log(|G(jw)|)
= -log(w)
- log(t)
Gaindb
= 20 log10(|G(jw)|)
= -20 log(w)
- 20 log(t)
Now, if we start with some frequency,
wo,
we can calculate the gain at the frequency.
Gaindb(wo)
= -20 log(wo)
- 20 log(t)
Now, take a frequency one decade higher, at 10wo.
Gaindb(10wo)
= -20 log(10wo)
- 20 log(t)
We can calculate the difference in the db gain at
these two frequencies.
Gaindb(10wo)
- Gaindb(wo)= [-20 log(10wo)
- 20 log(t)]
- [-20 log(10wo)
- 20 log(t)]
The difference is:
Gaindb(10wo)
- Gaindb(wo)
= -20 log(10wo)
+ 20 log(wo)
= -20 log(10) - 20
log(wo)
+ 20 log(wo)
= -20 log(10) = -20
db - in one decade!
Reflecting on the derivation
above, we realize that this derivation says that the slope is -20 db/decade
for the high frequency asymptote in the Bode' plot. It's also possible to
express that another way. If we consider two frequencies that are an octave
apart, we can see that the slope can also be said to be -6db/octave.
The difference in the
frequency response between the two frequencies is:
Gaindb(2wo)
- Gaindb(wo)
= -20 log(2wo)
+ 20 log(wo)
= - 20 log(2) - 20
log(wo)
+ 20 log(wo)
= -20 log(2) =
-6.0206 db - in one decade - and it's usually just rounded to -6db/octave.
It's time to leave this topic.
However consider this. We've only looked at one first order system. Higher
order systems - even second order systems - are bound to have some
differences in their Bode' plot behavior. High frequency asymptotes will
drop off at different slopes, for example, although we'll find that they
drop off at integral multiples of -20db/decade or -6 db/octave.
There are lots of
interesting things you need to know, and you can start looking at second
order systems now.
Bode'
Plots For 2nd Order Systems
We've looked at first order
systems. Remember our general goal:
- Given a
Transfer Function:
- Be able to
plot the Bode' plot, manually or with a math analysis program.
Know that the
Bode' plot you generated "makes sense".
Second order systems exhibit
behavior that you will never see in a first order system. We're going to
work on that goal for second order systems - systems that have this general
transfer function.
If we have this
transfer function:

- A little
reflection will probably tell you some things.
- For
example, this system could have two complex roots.
It's not
obvious, but to have two complex roots, the only thing necessary is that
the damping ratio, z,
be less than one.
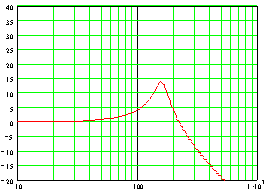
Here's a Bode' plot for a
second order system. This system has the following parameters:

This system also has at
least one unexpected feature - the "hump" in the frequency response between
f = 100 and f = 200 - a resonant peak. It's important to understand how that
peak in the frequency response comes about. Let's look at the transfer
function of a second order system. Here's a general form for such a system.
Examine how that system behaves for different frequencies.

Substitute s = jw,
to get the frequency response. For
small w,
the gain is just G dc.For
large w,
the gain is Gdc/w2.
That means that the high
frequency gain drops off at -40 db/decade.
- There are
intermediate frequencies where interesting things happen!
We will start by looking
at the interesting things that happen at the intermediate frequencies.
Here's the transfer function again, with s replaced now by jw.
We
will examine what happens when w= w n.

At
the natural frequency, the (jw) 2
term becomes -wn2,
cancelling out the last term in the denominator, the
wn2term, since j2 = -1.- Now, the really
interesting things start to happen. When those terms cancel the
denominator just has one term left, and we have:

Now we can find an
explanation for the hump in the frequency response.
The
only term that involves the damping ratio is the one left in the
denominator when w= w n.- The damping
ratio is in the denominator, so the smaller the damping ratio, the
larger the frequency response is going to be.
At
w=
w n,
the magnitude of the frequency response function is:
|

