Abstract
The use of a light microscope for the quantitative analysis of specimens
requires an understanding of: light sources, the interaction of light with the
desired specimen, the characteristics of modern microscope optics, the
characteristics of modern electro-optical sensors (in particular, CCD cameras),
and the proper use of algorithms for the restoration, segmentation, and analysis
of digital images. All of these components are necessary if one is to achieve
the accurate measurement of "analog" quantities given a digital representation
of an image. In this paper we will explore several of these issues in detail as
they provide important insights into the entire process and their importance is
frequently underestimated by practitioners.
Introduction
While light microscopy is almost 400 years old [1,2], the developments of the
past decade have offered a variety of new mechanisms for examining biological
and material samples. In this past decade we have seen the development and/or
exploitation of techniques such as confocal microscopy, scanning near field
microscopy, standing wave microscopy, fluorescence lifetime microscopy, and
two-photon microscopy. (See, for example, recent issues of Bioimaging and
Journal of Microscopy.) In biology the advances in molecular biology and
biochemistry have made it possible to selectively tag (and thus make visible)
specific parts of cells such as actin molecules or sequences of DNA of 1000 base
pairs or longer. In sensor technology modern CCD cameras are capable of
achieving high spatial resolution and high sensitivity measurements of signals
in the optical microscope. In computer processing we have learned how to process
digitized images so as to extract meaningful measurements of "analog" quantities
given digital data.
The applications that motivate and exploit these developments can be divided
into those in which the goal is the production of images that are to be used as
images by human observers and those where the images are to analyzed to produce
data for human interpretation. In the former case where we can speak of specimen
in -> image out the issue is image processing; in the latter case where we can
speak of specimen in -> data out, the issue is image analysis. As we hope to
demonstrate in this paper, the two different applications processing and
analysis can lead to different sets of conclusions in the choice of algorithms
and technical constraints such as sampling frequency.
In the case of image analysis we can also make a clear distinction between
problems of detection and problems of estimation. An example of a detection
problem might be finding the spots produced in a cell nucleus by molecular
probes that are specific for the DNA on either chromosome number 1 or chromosome
number 7. Using fluorescent dyes to color chromosome 1 green and chromosome 7
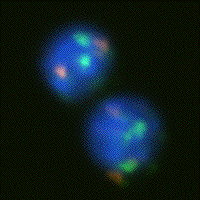
orange-red and to color the entire DNA content blue (see Figure 1a) the central
problem becomes the detection of the colored dots followed by simple counting.
As a second example we consider the measurement of the amount of DNA in each
cell in order to build a profile of the DNA distribution in a population of
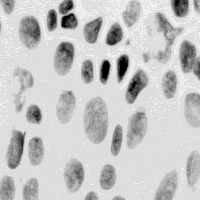
cells. In Figure 1b we see cell nuclei that have been stained with a
quantitative (stoichiometric) staining reagent (Feulgen) and where the amount of
stain per pixel is proportional to the DNA content per pixel.

 |
| (a) |
(b) |
Figure 1: (a) Human lymphocytes stained with fluorescent dyes DAPI
(blue), Spectrum Green, and Spectrum Orange to reveal total DNA content, the
centromeric DNA of chromosome 1, and the centromeric DNA of chromosome 7,
respectively. (b) Human tissue sampled stained with the absorptive dye Feulgen
that is quantitative for DNA content. The optical density per pixel is
proportional to the DNA content per pixel.
Waves and Photons
Modern physics has taught us that there are two, inter-related ways of
describing light - as waves and as a collection of massless particles, photons.
Both of these descriptions are necessary in order to understand the properties
and limitations of quantitative microscopy.
Waves - The wave description leads naturally to a consideration of the
wavelength of light being used,
 ,
and the diffraction limits of modern microscope lenses. A modern well-designed,
aberration "free" microscope lens may be characterized as an LSI system with a
point spread function (PSF) followed by a pure magnification system as shown in
Figure 2 [3]. ,
and the diffraction limits of modern microscope lenses. A modern well-designed,
aberration "free" microscope lens may be characterized as an LSI system with a
point spread function (PSF) followed by a pure magnification system as shown in
Figure 2 [3].
Figure 2: An "ideal" microscope lens has a point spread function that
is circularly symmetric h(r). This is followed by a magnification factor M.
Typical vales of M are 25x, 40x, and 63x. Note that the total lens system is not
shift invariant (SI) because moving the input image (in space) by a distance
 x
will cause the output image to move by M x
will cause the output image to move by M x
instead of x
instead of
 x. x.
The form of the PSF is circularly symmetric and given by:
 |
(1) |
where J1(�) is a Bessel function of the first kind. We see that for this
ideal case only two parameters are of consequence - the wavelength of light
 and the numerical aperture of the lens NA. The NA of the lens measures the
ability of the lens to collect light and is given by n�sin(
 )
with n the index of refraction of the medium between the lens and the
specimen and )
with n the index of refraction of the medium between the lens and the
specimen and
 the angle of acceptance of the microscope lens. Typical values of n are
1.0 (air), 1.3 (water), and 1.5 (immersion oil). A maximum value for
 is about 69�. This leads to values of NA that are less than 1.0 in air
and less than 1.4 in oil.
The optical transfer function (OTF) of an ideal, circularly-symmetric
microscope lens can be calculated. Because of the circular symmetry, H( x, x, y)
= F{h(x,y)} = F{h(r)} = H( y)
= F{h(x,y)} = F{h(r)} = H( r)
where F{�} is the Fourier transform operation. The OTF is given by: r)
where F{�} is the Fourier transform operation. The OTF is given by:
 |
(2) |
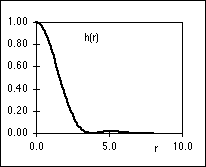
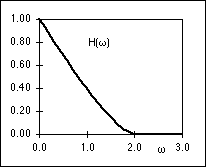
The PSF, h(r), and the OTF, H( r),
are shown in Figure 3. It is the PSF that gives rise to the well-known Airy disk
[4]. r),
are shown in Figure 3. It is the PSF that gives rise to the well-known Airy disk
[4].

 |
| (a) |
(b) |
Figure 3: (a) PSF, h(r), of an ideal microscope lens. (b) OTF, H( r),
of the ideal microscope lens. Both are evaluated for a = 1 in equations 1 and 2. r),
of the ideal microscope lens. Both are evaluated for a = 1 in equations 1 and 2.
An important feature of the OTF is that it is bandlimited. That is, there
exists a frequency
 c
such that H( c
such that H( c)
= 0 for | c)
= 0 for | |
> |
>
 c.
This cutoff frequency is given by: c.
This cutoff frequency is given by:
 |
(3) |
For green light with a wavelength of 500 nm. and using an oil-immersion lens
with NA = 1.4, this corresponds to a cutoff frequency of 5.6 cycles per �m
(microns). The Nyquist sampling theorem would then imply that an image to be
analyzed after sampling would require a minimum sampling frequency of 2 c.
In this example this implies 11.2 samples per micron or a maximum distance of
0.089 microns between samples. While this very fine sampling might appear to be
"overkill", we should remember that biological samples do contain arbitrarily
small physical details and thus the Fourier spectrum is not limited by the input
physical signal (the specimen) but rather by the diffraction limits of the
microscope objective (a low-pass filter). As a practical consequence, the
examination of a small human metaphase chromosome which is only about 1 micron
by 2 microns leads to a digital image of only 15 by 30 pixels as shown in Figure
4. c.
In this example this implies 11.2 samples per micron or a maximum distance of
0.089 microns between samples. While this very fine sampling might appear to be
"overkill", we should remember that biological samples do contain arbitrarily
small physical details and thus the Fourier spectrum is not limited by the input
physical signal (the specimen) but rather by the diffraction limits of the
microscope objective (a low-pass filter). As a practical consequence, the
examination of a small human metaphase chromosome which is only about 1 micron
by 2 microns leads to a digital image of only 15 by 30 pixels as shown in Figure
4.
Figure 4: (a) Small metaphase chromosome stained with the absorptive
dye Giemsa in order to reveal the band structure. (b) A 4x enlargement reveals
the small number of pixels involved in the digital image representation.
|

