The Lineshape and Kinetics


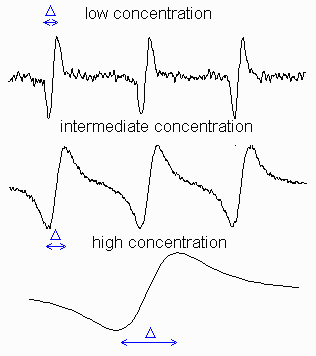
Figure
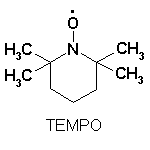
on the right shows how EPR signal shape of a stable radical, TEMPO (see its
structure on the left), varies with concentration (intensities were scaled to
the same hight). It illustrates that the linewidths of the resonant transitions
are not infinitely small and can be altered by the environment. At low
concentrations, each line has a width because of the heterogeneous
broadening, i.e. unresolved structure of the small hyperfine
constants and the homogeneous broadening, Go:
which is caused by a limited lifetime T2 (also called
a spin-spin relaxation time) of a radical at a particular spin state
(uncertainty principle related). The constant ge
is called the magnetogyric (or gyromagnetic) ratio and relates to Bohr's
magneton, mB,
| |
ge = 4pmB/h
= e/mec = 1.77 x 10⁷ s-1
G-1 |
(15) |
The full width half maximum, G, is 31/2/2
= 0.866 times greater than the measured distance between maximum and minimum of
the experimentaly detective derivative of absorption, i.e.
G = 0.866 D. This lifetime
can be affected by the dipole-dipole (and exchange) interaction with other
radicals. If another unpared electron is at a distance r, the magnitude
of its field at the spin can take any value between � 2mB/r3,
depending on orientation. Due to the fast rotation of both radicals, the
interaction averages this field to zero except for a very short period of time
during collision after which the radical can end up at a random configuration of
its nuclear spins. Result of such randomization is equivalent to the jumping
from one spectral position to another. For nitroxyl radical, such as TEMPO, with
three equivalent spectral lines (S = 1), only 2/3 of such collisions
result in a shift. Beacuse of that, the width will increase only at 2/3
of the rate of collision:
| Slow Exchange: |
G = Go + 2k[R]/3ge |
(16) |
where k is the collision rate constant and [R] is the concentration
of radicals. With further increase of the radical concentration, the continuing
broadening will be accompanied by a measureable decrease in separation between
the peaks, DB:
| Intermediate Exchange: |
(aN2
- DB2 )1/2 =
2k[R]/3ge? |
(17) |
where aN is the
hyperfine constant on nitrogen (separation between lines). After they coalesce,
the overall width of now a single-line spectrum, starts decreasing:
| Rapid Exchange: |
G = ge(aN2)/k[R] |
(18) |
The radicals can exchange spins not on themselves but on any
other radical as well. Oxygen has nonzero spin and can also cause the line
broadening by the same mechanism. So if your solvent is nonviscous and you want
to detect linewidths below 3 G, you may want to get rid of O2.
Experimental apparatus

The
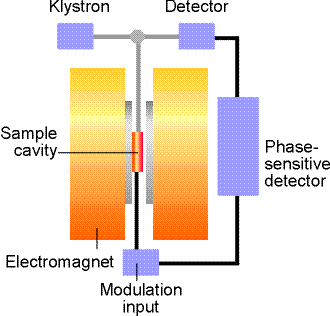
ESP-300 ESR spectrometer (Bruker) consists of an electromagnet with power
supplies to generate and modulate a uniform magnetic field of several thousand
Gauss, as well as the components that generate and detect microwave power. The
operation manual
is awailable on the web, courtesy of the University of Illinois at
Urbana-Champaign. I am putting
our version as well.
A static magnetic field is provided by an electromagnet with a
current- regulated power supply. A homogeneous field is required for best
results. A Hall probe, driven from a stable constant-current power system, with
a digital multimeter (DMM) reading the Hall voltage, is used to measure the
value of the magnetic field between the poles of the magnet.
The microwave system consists of a microwave power supply (on a
table above the magnet) which uses a clystron. The ouput of the microwave power
(mw) supply is connected via rectangular waveguide (10 GHz) and
through a circulator to a high-Q resonant cavity. The samples to be investigated
are mounted in the middle of the cavity, where magnetic component of the
microwave power has a maximum and is oriented perpendicular to
the static field. A microwave diode, which detects the mw
resides inside the same box as the power supply. The higher the quality of the
resonant cavity the greater the microwave field can be obtained on the sample.
Very polar solvents like water absorb efficiently on microwave frequencies
themselves (remember microwave ovens?). Because of that, water samples have to
be made in narrow cappilaries and carefully located in the center
of the cavity. Most of our measurements will be done in the 0.1 - 1.0 mW range.

There
are variety of schemes for detecting resonant EPR transitions. Historically,
most popular became a detection of absorption of the microwave power. To
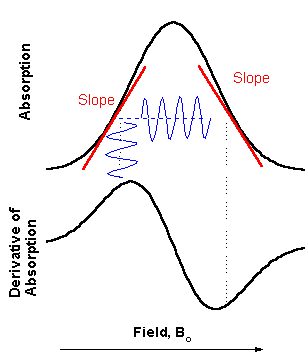
minimize the noise from the mw diode in steady state measurements, a magnetic
field modulation scheme with phase sensitive detection is usually employed. As a
result, the detected signal appears as a first derivative (see figure on the
right). In the Bruker spectrometer there is choice between 12.5 kHz and 100 kHz
modulation frequency. The amplitude of field modulation (MA) can be varied up to
40 G (4mT). Yo have to be careful in choosing appropriate MA. If MA is to big,
the width of detected signal derivative would be wider than the
real width of absorption, but if it is too small, the signal intensity
would be less. For most of your case it is good first approximation to set MA
between 0.5 and 1.0 G.
|

