Why should the proton nuclei in different compounds behave differently in
the nmr experiment ?
The answer to this question lies with the electron(s) surrounding the proton in
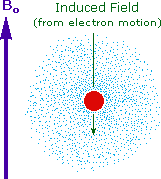
covalent compounds and ions. Since electrons are charged particles, they move in
response to the external magnetic field (Bo) so as to generate a
secondary field that opposes the much stronger applied field. This secondary
field shields the nucleus from the applied field, so Bo must
be increased in order to achieve resonance (absorption of rf energy). As
illustrated in the drawing on the right, Bo must be increased to
compensate for the induced shielding field. In the upper diagram, those
compounds that give resonance signals at the higher field side of the diagram
(CH4, HCl, HBr and HI) have proton nuclei that are more shielded than
those on the lower field (left) side of the diagram.
The magnetic field range displayed in the above diagram is very small compared
with the actual field strength (only about 0.0042%). It is customary to refer to
small increments such as this in units of parts per million (ppm). The
difference between 2.3487 T and 2.3488 T is therefore about 42 ppm. Instead of
designating a range of nmr signals in terms of magnetic field differences (as
above), it is more common to use a frequency scale, even though the spectrometer
may operate by sweeping the magnetic field. Using this terminology, we would
find that at 2.34 T the proton signals shown above extend over a 4,200 Hz range
(for a 100 MHz rf frequency, 42 ppm is 4,200 Hz). Most organic compounds exhibit
proton resonances that fall within a 12 ppm range (the shaded area), and it is
therefore necessary to use very sensitive and precise spectrometers to resolve
structurally distinct sets of hydrogen atoms within this narrow range.
In this respect it might be noted that the detection of a
part-per-million difference is equivalent to detecting a 1 millimeter difference
in distances of 1 kilometer.

π-Electron Functions
An examination of the proton chemical shift chart (above)
makes it clear that the inductive effect of substituents cannot account for all
the differences in proton signals. In particular the low field resonance of
hydrogens bonded to double bond or aromatic ring carbons is puzzling, as is the
very low field signal from aldehyde hydrogens. The hydrogen atom of a terminal
alkyne, in contrast, appears at a relatively higher field. All these anomalous
cases seem to involve hydrogens bonded to pi-electron systems, and an
explanation may be found in the way these pi-electrons interact with the applied
magnetic field.
Pi-electrons are more polarizable than are sigma-bond electrons, as addition
reactions of electrophilic reagents to alkenes testify. Therefore, we should not
be surprised to find that field induced pi-electron movement produces strong
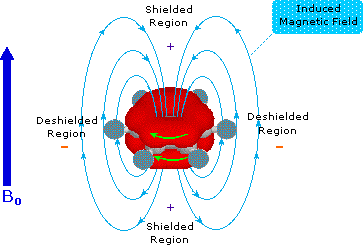
secondary fields that perturb nearby nuclei. The pi-electrons associated with a
benzene ring provide a striking example of this phenomenon, as shown below. The
electron cloud above and below the plane of the ring circulates in reaction to
the external field so as to generate an opposing field at the center of the ring
and a supporting field at the edge of the ring. This kind of spatial variation
is called anisotropy, and it is common to nonspherical distributions of
electrons, as are found in all the functions mentioned above. Regions in which
the induced field supports or adds to the external field are said to be
deshielded, because a slightly weaker external field will bring about
resonance for nuclei in such areas. However, regions in which the induced field
opposes the external field are termed shielded because an increase in the
applied field is needed for resonance. Shielded regions are designated by a
plus sign, and deshielded regions by a negative sign.
The anisotropy of some important unsaturated functions will
be displayed by clicking on the benzene diagram below. Note that the
anisotropy about the triple bond nicely accounts for the relatively high field
chemical shift of ethynyl hydrogens. The shielding & deshielding regions about
the carbonyl group have been described in two ways, which alternate in the
display.

|

